
[fusion_builder_container hundred_percent=”no” hundred_percent_height=”no” hundred_percent_height_scroll=”no” hundred_percent_height_center_content=”yes” equal_height_columns=”no” menu_anchor=”” hide_on_mobile=”small-visibility,medium-visibility,large-visibility” status=”published” publish_date=”” class=”” id=”” link_color=”” link_hover_color=”” border_size=”” border_color=”” border_style=”solid” margin_top=”” margin_bottom=”” padding_top=”” padding_right=”” padding_bottom=”” padding_left=”” gradient_start_color=”” gradient_end_color=”” gradient_start_position=”0″ gradient_end_position=”100″ gradient_type=”linear” radial_direction=”center center” linear_angle=”180″ background_color=”” background_image=”” background_position=”center center” background_repeat=”no-repeat” fade=”no” background_parallax=”none” enable_mobile=”no” parallax_speed=”0.3″ background_blend_mode=”none” video_mp4=”” video_webm=”” video_ogv=”” video_url=”” video_aspect_ratio=”16:9″ video_loop=”yes” video_mute=”yes” video_preview_image=”” filter_hue=”0″ filter_saturation=”100″ filter_brightness=”100″ filter_contrast=”100″ filter_invert=”0″ filter_sepia=”0″ filter_opacity=”100″ filter_blur=”0″ filter_hue_hover=”0″ filter_saturation_hover=”100″ filter_brightness_hover=”100″ filter_contrast_hover=”100″ filter_invert_hover=”0″ filter_sepia_hover=”0″ filter_opacity_hover=”100″ filter_blur_hover=”0″][fusion_builder_row][fusion_builder_column type=”1_1″ layout=”1_1″ spacing=”” center_content=”no” link=”” target=”_self” min_height=”” hide_on_mobile=”small-visibility,medium-visibility,large-visibility” class=”” id=”” hover_type=”none” border_size=”0″ border_color=”” border_style=”solid” border_position=”all” border_radius=”” box_shadow=”no” dimension_box_shadow=”” box_shadow_blur=”0″ box_shadow_spread=”0″ box_shadow_color=”” box_shadow_style=”” padding_top=”” padding_right=”” padding_bottom=”” padding_left=”” margin_top=”” margin_bottom=”” background_type=”single” gradient_start_color=”” gradient_end_color=”” gradient_start_position=”0″ gradient_end_position=”100″ gradient_type=”linear” radial_direction=”center center” linear_angle=”180″ background_color=”” background_image=”” background_image_id=”” background_position=”left top” background_repeat=”no-repeat” background_blend_mode=”none” animation_type=”” animation_direction=”left” animation_speed=”0.3″ animation_offset=”” filter_type=”regular” filter_hue=”0″ filter_saturation=”100″ filter_brightness=”100″ filter_contrast=”100″ filter_invert=”0″ filter_sepia=”0″ filter_opacity=”100″ filter_blur=”0″ filter_hue_hover=”0″ filter_saturation_hover=”100″ filter_brightness_hover=”100″ filter_contrast_hover=”100″ filter_invert_hover=”0″ filter_sepia_hover=”0″ filter_opacity_hover=”100″ filter_blur_hover=”0″ last=”no”][fusion_text columns=”” column_min_width=”” column_spacing=”” rule_style=”default” rule_size=”” rule_color=”” hide_on_mobile=”small-visibility,medium-visibility,large-visibility” class=”” id=”” animation_type=”” animation_direction=”left” animation_speed=”0.3″ animation_offset=””][/fusion_text][fusion_imageframe image_id=”2538|full” max_width=”” style_type=”” blur=”” stylecolor=”” hover_type=”none” bordersize=”” bordercolor=”” borderradius=”” align=”none” lightbox=”no” gallery_id=”” lightbox_image=”” lightbox_image_id=”” alt=”” link=”” linktarget=”_self” hide_on_mobile=”small-visibility,medium-visibility,large-visibility” class=”” id=”” animation_type=”” animation_direction=”left” animation_speed=”0.3″ animation_offset=”” filter_hue=”0″ filter_saturation=”100″ filter_brightness=”100″ filter_contrast=”100″ filter_invert=”0″ filter_sepia=”0″ filter_opacity=”100″ filter_blur=”0″ filter_hue_hover=”0″ filter_saturation_hover=”100″ filter_brightness_hover=”100″ filter_contrast_hover=”100″ filter_invert_hover=”0″ filter_sepia_hover=”0″ filter_opacity_hover=”100″ filter_blur_hover=”0″]https://adaptera.gr/wp-content/uploads/2020/05/Dashboard-Blog-Header.jpg[/fusion_imageframe][fusion_text columns=”” column_min_width=”” column_spacing=”” rule_style=”default” rule_size=”” rule_color=”” hide_on_mobile=”small-visibility,medium-visibility,large-visibility” class=”” id=”” animation_type=”” animation_direction=”left” animation_speed=”0.3″ animation_offset=””]
Over the last several years, boards and management teams have started to take a greater interest in IoT/ICS cybersecurity. As reports of high profile IoT/ICS attacks and breaches becoming more prevalent in the media, senior leadership interest and auditors are asking more questions about their organizations’ IoT/ICS risk posture. Now, teams responsible for IoT/ICS security have the opportunity to demonstrate security and value to the board, earning more resources, mindshare, and funding.
We’ve talked to many security leaders about how they manage the relationship between IoT/ICS security and business leadership. Their answers are often the same: the key is presenting risk in clear, honest, high-level terms, and demonstrating what that information means for business as a whole.
There are a number of ways that you could do this effectively, and all of them have one thing in common: data. And increasingly, we see cybersecurity experts turning to dashboards to demonstrate value, risk, and continuous improvement to their leadership.
Ultimately, building an effective dashboard is the art of bridging the gap between data and action. When you’re starting to build your dashboards, asking yourself these three questions can put you on the right track:
- What is the question I’m trying to answer? This may seem so obvious that it should go without saying, but sometimes, it can be easy to get so bogged down in charts and graphs that you lose sight of the ultimate message. The simpler the question, the better. Maybe you’re trying to demonstrate improvement, and you’re trying to answer the question, “How has my risk increased or decreased week over week?” Or maybe, you’re trying to easily identify vulnerabilities that need to be patched: “When a new CVE is announced, which of our devices are affected?” Or, “Am I compliant with standard frameworks like NIST CSF or regulation XYZ? ”
- What are the most effective datapoints to use to answer that question? Once you’ve established what you’re trying to say, you need to establish the most effective data to measure that metric. Don’t be afraid to think outside the box — sometimes, the most effective answers come from combining data from two different sources. For example, combining alert or risk data with geolocation data would allow you to identify hotspots of risk across worldwide sites.
- What is the most effective visual to communicate this quickly and clearly, even to someone who doesn’t know the technology? This is a key consideration when we’re talking about reporting to management. While leadership wants to know that you’re addressing IoT/ICS security risk to the appropriate level that matches their risk appetite, they may not (and in fact, likely don’t) have the level of technical expertise that you do. Keep this in mind when designing your reports and dashboards. You need to communicate the broad strokes at a glance to someone who won’t have you in the room to explain what they’re looking at.
Dashboards in Action
Words are all well and good, but just like a good dashboard, a visual will get our point across much more effectively. So below, I’ll be walking you through two examples of IoT/ICS security dashboards, what they communicate, and why they’re effective. Of course, your dashboards will need to fit your specific needs — but these will hopefully give you a few ideas to steal for your next reporting project.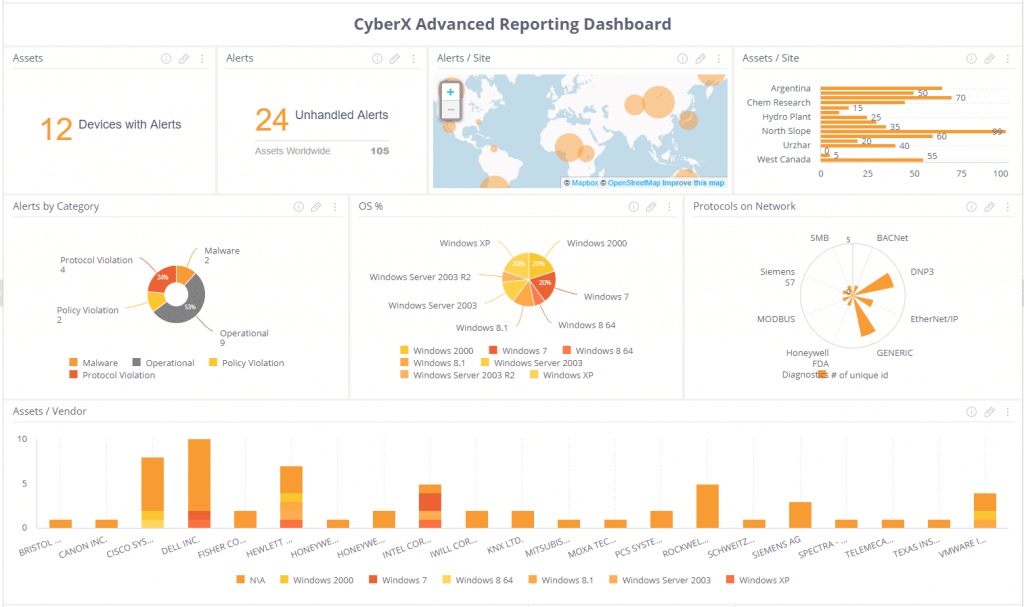
Dashboard 1: A bird’s eye view of IoT/ICS risk
This is an example of a dashboard that illustrates a bird’s eye view of IoT/ICS risk. While this might be a little more detailed than the information one might present to, say, the board, this type of dashboard is perfectly suited to giving leadership within the security teams an at-a-glance few of risk on any given day.
What makes this dashboard effective?
- Alert Details – Numbers alone doesn’t tell you much (especially when that number is higher than you wish it was!). This dashboard breaks down that number into more meaningful bite-sized chunks by showing you unresolved (unhandled) alerts and a pie chart of alerts by alert type, so you can start the day with an immediate high-level understanding of your problem areas.
- Alerts per Site – For an even bigger-picture view, consider visualizing your alerts by site or geolocation. Frequently, one or a handful of sites could be causing the bulk of your issues — and the sooner you can see those trends, the sooner you can address the root problem.
- The IoT/ICS Asset Landscape – You can never have too much information about your own IoT/ICS asset landscape, which means knowing which devices you have on your IoT/ICS networks and details about them, such as demonstrated here in the form of the OS pie chart, vendor bar graph, and protocol chart. These charts mean that at any given moment, you can understand your IoT/ICS asset and vendor landscape at a high level.
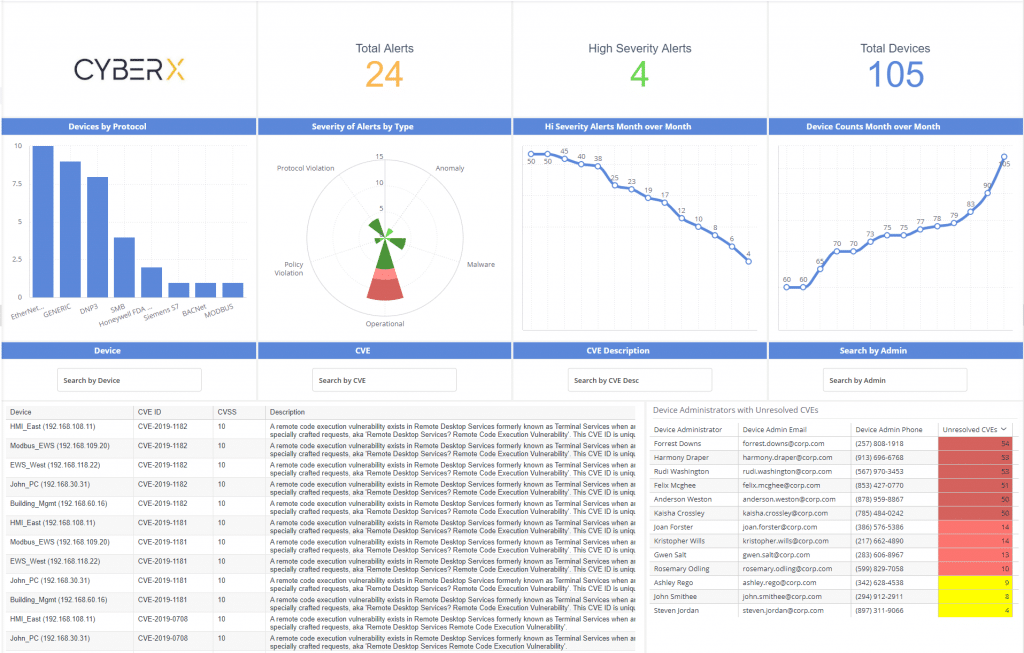 Dashboard 2: Tracking improvement over time and unaddressed CVEs
This dashboard tracks risk and improvement over time, and also acts as a hub to identify unaddressed CVEs and who’s responsible for them.
What makes this dashboard effective?
- Tracking improvement – By tracking the number of alerts month over month, this dashboard shows you — and demonstrates to leadership — that you are implementing the right controls to strengthen your security posture and reduce risk over time.
- CVE management – One of the most common IoT/ICS security questions from upper management is, “Have we addressed this CVE?” This dashboard can answer that question immediately with a search function and a table that indexes all unaddressed CVEs with the organization’s asset inventory. It also maps that information to device owners, so the analyst can create an automated workflow that notifies all stakeholders responsible for addressing those particular CVEs, and in what devices.
Where to Start
If you find yourself getting overwhelmed, come back to the core of your project: demonstrating the most effective answer to your primary question. The clearer and more specific your goal is for a certain dashboard — whether that’s demonstrating a reduction in risk, identifying CVEs, or proving regulatory compliance — the more effective the final result will be.
Many security platforms offer some form of reporting dashboards. The examples discussed in this article were created using CyberX’s Advanced Reporting Dashboard (ARD), which offers a customizable and flexible view into your organization’s IoT/ICS security and compliance landscape. The CyberX ARD integrates out-of-the-box with a broad range of enterprise data sources — such as Splunk, Rapid7, and ServiceNow, as well as standard databases, data warehouses, and via REST APIs — to give you the answers that are most important to your organization. If you’re interested in learning more about ARD, you can download the solution brief here.
Or, if you’d like to have a one-on-one discussion about how CyberX can help you define, fulfill, and demonstrate your IoT/ICS security goals, contact us here.
[/fusion_text][/fusion_builder_column][/fusion_builder_row][/fusion_builder_container]