
IT’s Big Data
When IT problems strike, the key to prompt resolution is hiding in the data – data produced when the fault occurs, historical data, and live data obtained while troubleshooting. Ensuring that we have the right data from the right time for the right problem is critical. IT data is therefore central to all that network operations does and is key to resolving the flood of alerts and tickets that hit IT operations teams every day.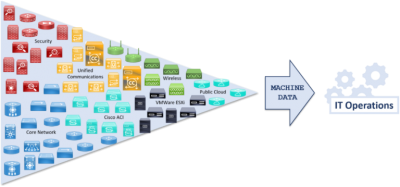
Figure 1: Infrastructure’s raw machine data
Today’s complex infrastructures hold more data than ever, locked inside devices and spread across SNMP retrieval or other systems which contain details on topology, performance, design intent, and the current state and behavior of all the devices in your network.
The most essential data for troubleshooting is obtained via the device CLI or API, usually pulled manually and sequentially, one device at a time. In fact, most troubleshooting time is spent navigating these command-line diagnostics.
Given that this is a mostly manual process, how can we hope to scale our troubleshooting efforts in tackling the endless sea of tickets? To scale beyond human capabilities, we need to use network automation.
NetBrain’s Data Model is the Foundation for Network Automation
As we know, network engineering is very inefficient at a procedural level. Engineers sequentially run checks across many devices to get one or two numbers or results. IT tools hold a plethora of other useful analytics and data, but accessing IT tool data involves clicking though multiple GUIs or consoles and correlating the findings.
Gathering necessary data to troubleshoot is a very lengthy process for engineers, often taking longer than the time to analyze the data. Furthermore, today’s data is multi-dimensional, multi-format, and spread across many different devices and systems, providing considerable challenges in analyzing the information efficiently.
On top of the complexity of IT’s Big Data, when tackling any problem, engineering teams must also have a time-series perspective on this data. In other words, we need contextual data obtained from different points in time to narrow down and isolate the root cause of any problem.
Without the aid of automation, engineers struggle to manually retrieve and assemble the necessary data in a timely fashion, resulting in delays in problem and ticket resolution.
NetBrain automation solves this by automatically (1) discovering your hybrid network, (2) extracting its rich data, and (3) baselining your complex infrastructure and all its vast amounts of information, creating a dynamic, mathematical data model of your entire environment.
Automated Network Discovery
NetBrain supports every hybrid IT environment, end-to-end, including legacy or traditional networks, software-defined or virtual networks, and public cloud infrastructures. Using a combination of automated SNMP, CLI, and API mechanisms and NetBrain’s patented neighbor discovery algorithms, NetBrain can crawl across the largest environments with scalable efficiency.
While SNMP is used for platform identification and other useful telemetry, the richer diagnostic and design intent data is pulled in via automated CLI or API retrieval. This ensures that NetBrain’s data model contains not just the detailed information on configuration, platform type, hostname, and IP addressing, but also the complexity of design intent and layer 2, layer 3, software defined, and virtual network topologies.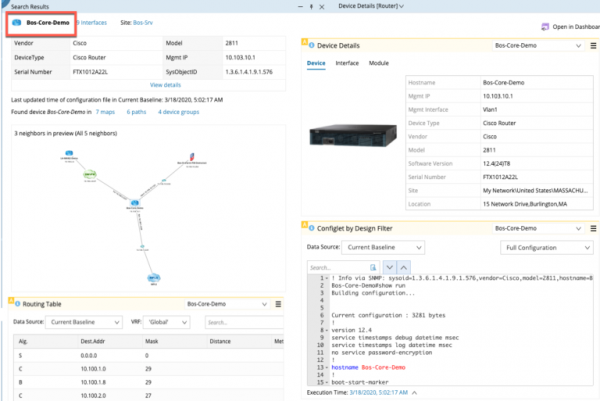
Figure 2 – NetBrain’s node discovery
Automated Data Extraction
The first step of data analysis is data extraction – ensuring that we have both quality data and multi-dimensional data are essential to high-quality analysis.
Today’s IT data lives in machines in the forms of condition telemetry, telling us the health of performance mechanisms such as CPU, memory, network interface statistics, and state information. This provides data on the current behavior of the network including end-to-end application paths, forwarding tables, active/failover statuses, and so on. When a network fault occurs, these two critical data types are generated.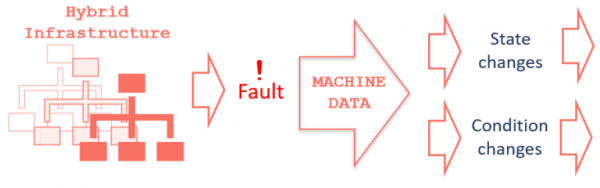
Figure 3 – Network fault generated data
With condition data, engineers can review changes across health metrics such as CPU, memory, interface errors, and so on. This would typically be supporting data, but can help to pinpoint impact radius and root cause.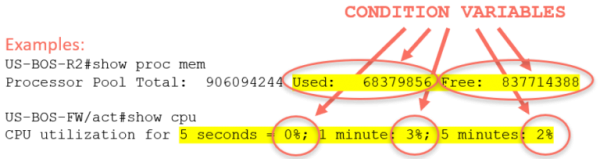
Figure 4 – Condition variable baselining
.
With state change data, engineers can determine if there is a variation from previously baselined network behavior. Examples here include firewall failovers, control plane changes, and BGP peering changes.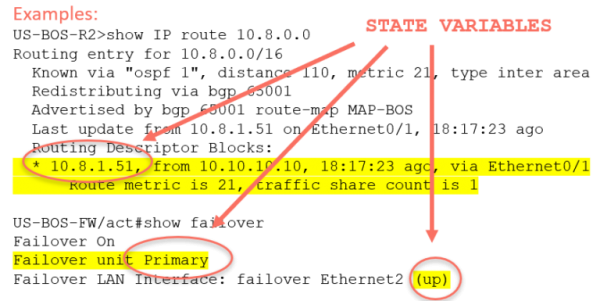
Figure 5 – State variable baselining
.
In analyzing combined condition and state data, engineers can narrow in on root cause. NetBrain automates all network data extraction, ensuring that you always have a current, complete picture of your infrastructure and that all relevant network condition and state data is always at your fingertips.
Automated Data Analytics
When investigating IT tickets, engineers will need to quickly determine if the data they are looking at is normal, or what has changed. Vital to this activity is having multiple data points in time for time series analysis. Engineers must compare (1) live data, (2) data from the time of the event, and (3) baselined data, calculated over time.
Core to NetBrain’s data model is its data baseline algorithms – by automatically calculating the “normal” state or value for complete variables within your network, engineers can quickly know when there are deviations from previous healthy network states.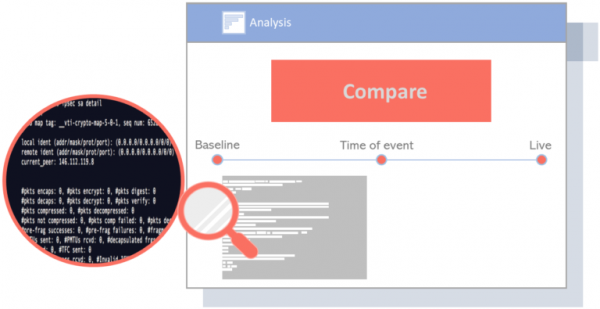
Figure 6 – Time series analysis
.
With these three critical data points – live data, time of event data, and baseline data – NetBrain automation can tackle any IT ticket from the three needed perspectives essential to isolate root cause:
- Baseline data – to understand what has varied from the network’s normal
- Time of event data – automatically gather diagnostics and potentially transient data the moment a fault occurs
- Live data – powered by automation but initiated by the engineer during analysis of the above two data points
Automated Data Visualization
In the field of IT, no matter what data you want to analyze, applying data visualization seems to be a necessary step. NetBrain absorbs IT’s Big Data, with details on every node, link, performance metrics, design intent, and converts it into a visual analogue in the form of a NetBrain Dynamic Map.
A Dynamic Map acts as a visual mechanism to diagnose your IT infrastructure and to containerize the diagnostic data being analyzed. Enabling detailed, layered views of your network and IT data, engineers can review complex problems from multiple angles in real time.
NetBrain’s data model combined with the automated data visualization of the Dynamic Map facilitates an easy-to-understand user view into the complexity of your IT data and is your user interface for network automation.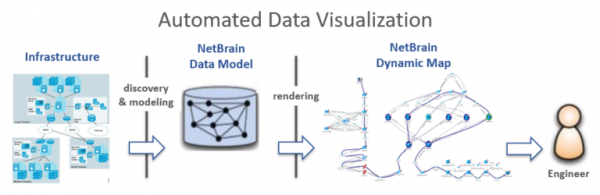
Figure 7 – Data visualization software architecture
.
Digital Twin of Live Network
The result of NetBrain’s deep discovery, data extraction, and automated baseline is a comprehensive mathematical data model of your live environment, complete with details on design intent, topology, and the inner workings of all the pieces.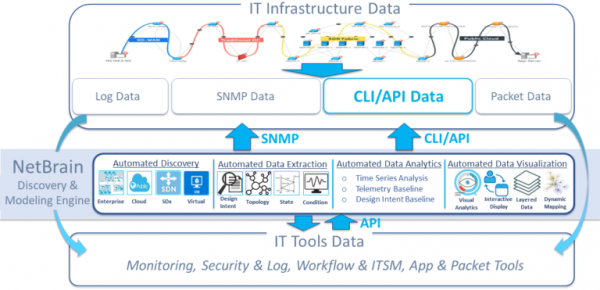
Figure 8 – NetBrain’s Integrated Data Model Architecture
.
NetBrain’s data model provides the foundation for all network automation and powers NetBrain’s two fundamental automation technologies – the Dynamic Map for automated data visualization and your user interface for network automation, and the Executable Runbook to codify and automate all your diagnostic and operational procedures.
NetBrain’s data model thus acts as a “digital twin” of your live network, containing all the data and baseline analysis that IT operations teams need to automate complex environment-wide diagnostics and to tackle every IT ticket with a speed and efficiency that dwarfs yesterday’s manual methods.